MacGDBp
Live, interactive debugging of your running PHP applications!

Skip, Step, Stop
MacGDBp’s debugger controls allow you to walk through each line of code. The three stepping controls
function like a traditional debugger: step in to a function call, moving down the stack; step out to
let the function run to completion, moving up the stack; and step over, letting the function call
run without stepping in. The continue button will let the application run to the next breakpoint or
completion.

Break it Down
Breakpoints let you stop at specific points in your program. In MacGDBp, there are two ways to set
breakpoints: by clicking on a specific line number in a file, or by entering a function or method
name. For file-line breakpoints, the program will pause execution when the line is hit, giving you
the opportunity to inspect the program state at that location. For symbolic breakpoints, whenever
the specified function or method is called, the program will similarly pause. Having two ways to set
breakpoints gives you flexibility in your debugging.
Thorough Examination
As you debug your code, MacGDBp will always display the function call stack and the source code for
the current file. MacGDBp also lets you inspect variables at each stack frame, including large and
complex arrays and objects. There is also an tab to evaluate arbitrary PHP expressions, letting you
change the contents of variables, or call functions to further inspect the program’s state.

Deep Inspection
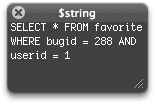
When working with variables in the debugger display, you can bring up an inspector HUD to view the
entire contents of the variable. This lets you quickly inspect the values of long strings, such as
SQL queries or HTML templates.
Bug Reports
Please report any issues on
Codeberg. Pull requests are also
accepted.
System Requirements
- PHP with the Xdebug extension and remote debugging enabled
- macOS 10.9 or higher